


Global smartphone usage topped 2.3bn in 2017. Based on an estimated world population of 7.6bn, that’s over 1 in 3 people who now own one.
Usage figures continue to grow steadily, over a decade after the release of the original iPhone, as this chart showing smartphone users (in billions) illustrates;
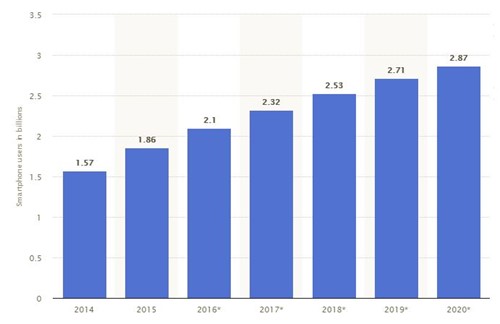
An incredible 91% of those surveyed in a recent Deloitte Consumer Survey reported using their smartphone at least once within the last 24 hours, making it by far the most ubiquitous device we own. In fact, smartphones are so ingrained within our lives and daily routines that 55% of us check them within 15 minutes of waking and 46% of us check them 15 minutes before going to sleep.
Reversing a trend of miniaturisation, devices (and screens) are now growing in size and practicality, while any initial resistance about using smartphones to purchase online is fading as website developers improve usability, regardless of device. Responsive hotel website design has shifted from being a ‘nice-to-have’ to becoming absolutely essential for those keen to maximise direct bookings.
To better understand smartphone usage and booking trends in the hotel industry, we took time to analyse the data from over 400 four and five star hotels included within the data set of our free benchmarking service, Hotel Benchmark, to answer the following questions.
1. WHAT PERCENTAGE OF HOTEL WEBSITE TRAFFIC IS DRIVEN BY MOBILE, DESKTOP & TABLET?
Across the entire data sample, desktop still edges out mobile in driving the most traffic to the hotel websites we evaluated. However, this varies by property and location and some of our clients are seeing 60%+ of traffic originating on mobile, with tablet traffic remaining fairly flat year-on-year.
2. WHAT PERCENTAGE OF HOTEL WEBSITE REVENUE IS DRIVEN BY MOBILE, DESKTOP & TABLET?
Despite accounting for a significant volume of website traffic, mobile still only accounts for 10.2% of total website revenue across the hotels we evaluated. Again, this figure is growing as the usability of mobile booking engines improves and user confidence in purchasing on smartphone devices increases. These figures lend credence to the widely held industry opinion that smartphones are used more for information search, in the early stages of travel planning.
3. HOW DOES CONVERSION RATE VARY ON MOBILE, DESKTOP & TABLET?
Perhaps unsurprisingly, mobile converts the least at just 0.19% of all website visits, while desktop converts highest at 1.85% and tablet languishes a little behind at 1.46%.
Within our data set we have both 4 and 5 star hotels. Generally the conversion rate for 4 star properties tends to be higher than that of 5. We would suggest that this is likely due a number of factors; perhaps the guest of a 5 star hotel is a little more exacting in their requirements and therefore more likely to call to ask questions and book. We also find that 5 star hotels often have a lot of ancillary services such as luxurious spas, high profile destination restaurants etc. that attract traffic but can’t convert directly into room bookings.
We found the mobile conversion of 4 star hotels to be 0.25%, with 5 star hotels 0.15%. There’s a greater disparity of conversion between 4 and 5 star hotels on mobile (40%) than that of desktop conversion; 1.99% for 4 star hotels and 1.71% for 5 star hotels (a difference of 14%), suggesting that those in the market for 5 star hotels are much less likely to book via smartphone.
4. HOW DOES PERFORMANCE VARY ON DIFFERENT MOBILE PLATFORMS (ANDROID, BLACKBERRY, WINDOWS, IPHONE)?
Here’s where the data got really interesting for us – does the type of device being used impact the results? As the table below suggests, the answer is a resounding yes. Despite having a market share of 85.9% in 2017 (according to Gartner), Android devices only accounted for 37.5% of sessions and 24.2% of revenue. This compares to iOS devices that had a market share of 14.0% but drove 61.3% of traffic and 69.7% of revenue!
4.1 Which platforms drive the most traffic?
iOS is the clear winner here, with 61.3% of total mobile sessions driven by Apple’s operating system. Android lags behind with 37.5% and Windows and Blackberry barely make a dent with just 1% between them.
4.2 Which platforms drive the most revenue?
Again, iOS comes out on top with 69.7% of mobile revenue production, followed by Android at 24.2% and Windows/Windows Phone with 5.7% – higher than one might expect given the traffic volumes, the result of a strong conversion rate.
4.3 Which platforms convert the best?
Interestingly, Windows/Windows Phone tops the conversion charts at 0.91%, although we should highlight that Microsoft’s Xbox consoles feature within this data – being a larger screen this could be affecting conversion rates. Other platforms (including smart TV’s running mobile browsers, Symbian, Nokia, Linux, Firefox OS etc.) drove the second highest conversion – although it only amounted to 0.3% of total revenue. iOS was third best at 0.21%, followed by 0.14% from Android.
4.4 Does average order value vary by platform?
This was particularly of interest for us. We found that the average order value for iOS users was £687.12 compared to £586.47 for Android users. We’d love to hear the industry’s opinion as to why these figures differ (please leave a comment below). Our thoughts are that iOS powered devices (iPhones, iPads etc.) are generally a premium product, priced accordingly, and perhaps those that can afford this premium are more inclined to purchase luxury travel, stay longer etc.?
5. DOES SMARTPHONE TRAFFIC AND REVENUE VARY BY COUNTRY?
Finally, we wanted to evaluate whether mobile traffic and revenue varied by country. Note, we only analysed countries where there was a sufficient volume of data to draw reasonable conclusion.
5.1 Website traffic distribution by country
From Q1 we know that the average traffic distribution across the world was 46% desktop, 44% mobile and 10% tablet. Comparing this against the below, a few countries stand out as significantly different;
- India – high desktop traffic, low tablet traffic
- Russia – high desktop traffic, low tablet traffic
- Saudi Arabia – low desktop traffic, very high mobile traffic, low tablet traffic
- United Arab Emirates – high mobile traffic
- United States – surprisingly high desktop traffic, low mobile traffic
5.2 Website revenue distribution by country
From Q1 we know that the average revenue distribution across the world was 79% desktop, 10% mobile and 11% tablet. Again, a few countries stand out as significantly different;
- Australia – high revenue from tablet
- France – high revenue from desktop, low revenue from mobile
- Hong Kong, Japan, Singapore – low revenue from mobile
- Saudi Arabia – high revenue from mobile
- Switzerland – high revenue from desktop, relatively low revenue from mobile
- United Arab Emirates – despite high mobile traffic, mobile revenue only average
WHAT CAN WE DO WITH THIS DATA?
Data is only really useful if it fuels action. So what actions can we take, now that we understand smartphone buying behaviour a little better? Here’s a few ideas to get started;
- If smartphone users are checking their phones first thing in the morning and last thing at night, why not setup a time-targeted mobile campaign to inspire travel to your hotel? Not a hard-sell ‘book, book, book!‘ campaign, but something to seed travel wanderlust, just before they head off to dream about their next big trip. Or why not time-target a rush hour campaign to catch them on their commute?
- In a similar vein, time-target (and radius-target by location) campaigns for your food and beverage offering so that you display adverts to those very much in-market and searching for ‘restaurants near me’ with a relevant message – e.g. at lunchtime, show an advert mentioning a fantastic fixed price lunch menu.
- Seed the desire to travel with a well placed Instagram post/advert where the audience is primarily mobile and brand engagement is apparently 10 times higher than other social channels. According to recent research, 1/3 of Instagram users have used their mobile to purchase a product online!
- Adjust your paid advertising bids to focus attention on mobile and experiment with targeted messaging to mobile devices – e.g. ‘mobile devices with full browsers’ in Google AdWords and ‘mobile’ only in Facebook.
It’s also important to remember that evaluating performance on a last click attribution model is unlikely to give you the full picture of the impact of mobile. As comScore’s 2017 Communications Markets report highlighted, the vast majority of users are ‘multiscreening’ – i.e. they use both desktop and smartphones, rather than either device exclusively.
Looking to develop a mobile marketing strategy for your hotel? We’d love to help.