


Since the start of the pandemic, it’s clear that city-based hoteliers have been hit hardest, fuelled by a significant drop in corporate travel along with largescale conferences and events moving online. Indeed, during the recent (virtual) Annual Hotel Conference, STR highlighted that occupancy levels for the week ending September 27th remained at just 30% in London, among the lowest in Europe. Only Paris, Rome and Madrid recorded lower at 25, 21 and 20% respectively. Contrast this to some of the top performing areas of the UK; Plymouth saw occupancy rates of 91%, Inverness at 81% and Southampton at 69%, driven by a domestic ‘summer staycation’ boom.
However, there does appear to be a little light at the end of this tunnel for London. Business on the books data from STR shows some demand for Spring and the gaps between last year and today appear to be gradually closing.
Of course, while not particularly helpful to hoteliers, the data suggests that business is extremely short lead – as travellers leave planning to the last minute, hesitant to pre-book given ever-changing Governmental guidelines.
It’s a continually changing picture, but as IHG’s CEO, Keith Barr, noted at the Annual Hotel Conference, “The demand for travel is still there, when it safe to do so”. That’s certainly proven true by a recent survey of over 3,000 guests conducted by 80 DAYS, where a resounding 99% said they intend to travel in 2020/21. We can also look to China’s recovery as an excellent point of reference here, where hotels are now reporting record occupancy levels along with full restaurants, aeroplanes and trains.
But how is London trending digitally? We evaluated data from our sister company, Hotel Benchmark, comparing London with the rest of the UK to consider what we might expect in the final quarter of what has been a very unpredictable year.
WEBSITE SESSIONS & TRANSACTIONS
London vs. UK
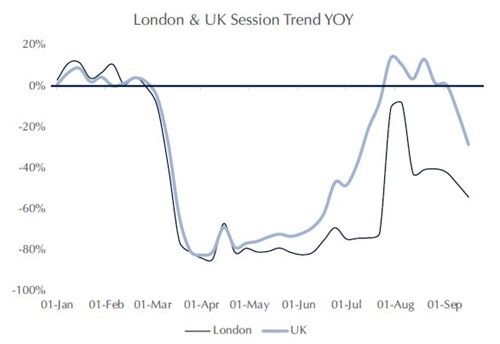
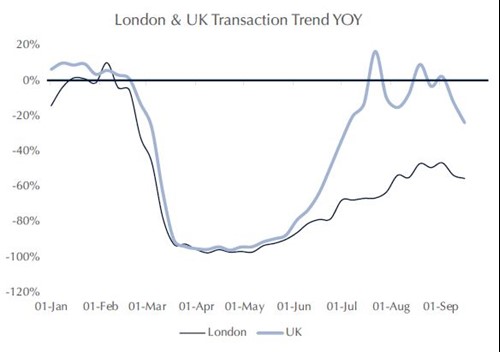
How are the websites of London hotels performing vs. the rest of the UK?
- Website sessions (traffic) across London hotels dropped to similar levels as the rest of the UK at the start of the pandemic but are taking longer to recover to pre-pandemic levels.
- August was a more positive month for both London and the rest of the UK, although September and October continue to be challenging.
- However, the gap between London and the UK, for transactions, does appear to be gradually closing, since June.
By Age Group
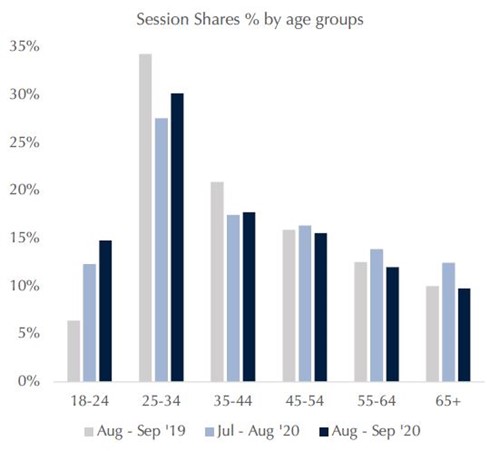
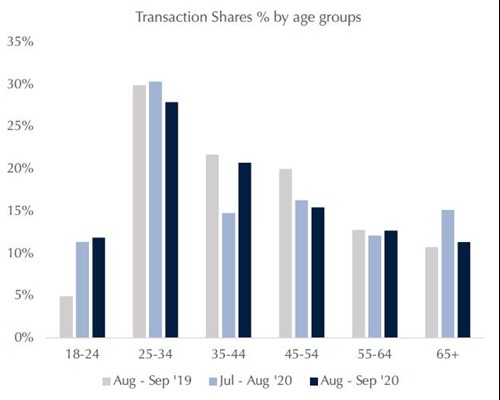
What age groups are most likely to visit (and book) a London hotel?
- Overall, the 25 – 34 age group has generated the highest levels of online traffic and transactions.
- However, the 35 – 44 age group is seeing the strongest period-on-period increases.
- Meanwhile, the 18 – 24 age group shows significant year-on-year increases for both session and transaction share.
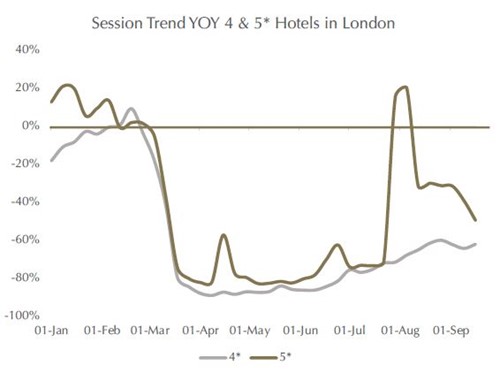
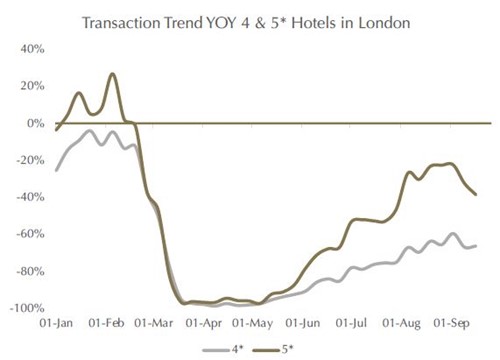
By Star Rating
Does recovery differ for 4-star vs. 5-star hotels in London?
- 5-star hotels in London appear to be recovering at a faster rate, both in terms of sessions and transactions.
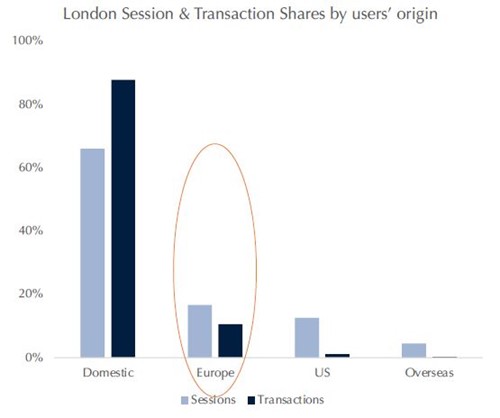
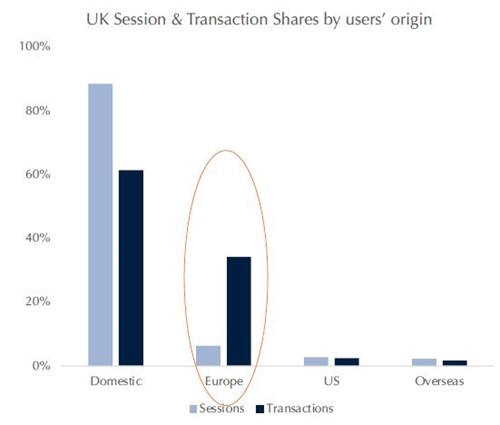
By Guest Origin (International Business)
Where are guests coming from when visiting London (and the UK)?
- Unsurprisingly, the majority of business for both London and UK hotels is domestic.
- Some international travel remains, with hotels across the UK are registering 34% of bookings from European countries on average, in comparison to just 11% in London hotels.
- The US market, as one would expect, is significantly down for both London and the UK as a whole.
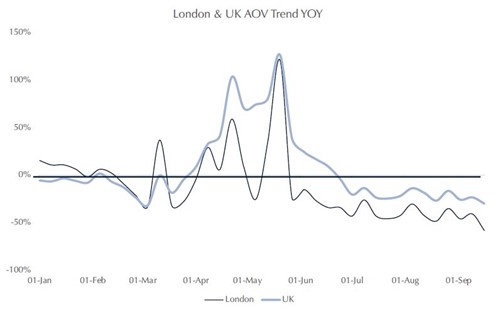
AVERAGE ORDER VALUE
London vs. UK
How have average order values (transactions) been affected?
- The UK and London average order value recovery trend is similar when compared year-on-year.
- After a major spike in May, the year-on-year gap in the average order has decreased steadily.
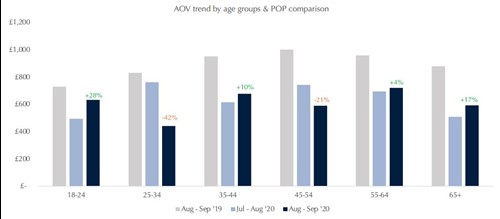
By Age Group
Are different age groups spending more/less than others?
- All age groups are spending less on average compared to the same period last year.
- The 35 – 44, 55 – 65, 55+ age groups appear to be experiencing a gradual recovery in average order value when compared period-on-period.
SLOW, BUT STEADY
It’s clear that there’s a long road ahead for London’s recovery, but we are starting to see the year-on-year gaps slowly, but steadily, closing. Of course the future is, unfortunately, less predictable and we’d encourage London hoteliers to sign up to our free benchmark report and measure their performance relative to the industry ongoing.